Configuring General Loudness Analyzer Settings
Perform this procedure to define time zone as well as search parameters when searching for loudness log files.
1. In Loudness Analyzer, on the Options menu, click View Settings.
[ Graphic ]
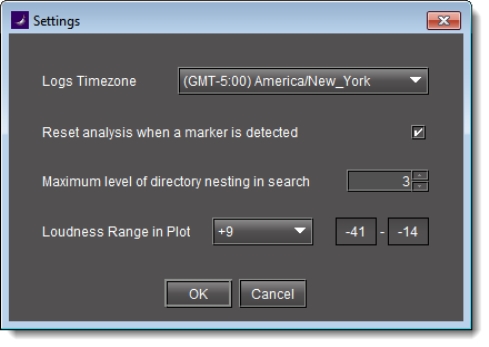
The Settings window appears.
[ Graphic ]
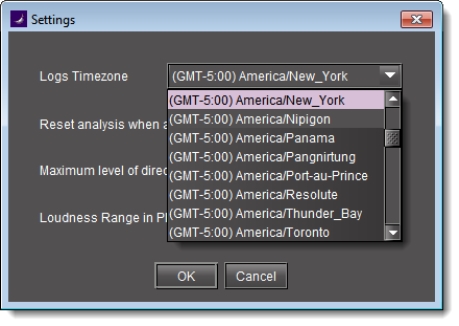
2. Select the time zone that matches your logs.
NOTE: Loudness Analyzer is time zone-agnostic, meaning it displays a data plot’s time code as UTC (coordinated universal time). When you configure your general Loudness Analyzer settings, make sure you set the time zone to that of the signal being analyzed. |
[ Graphic ]
3. Select Reset analysis when a marker is detected if you would like for the integrated value to reflect only those data belonging to the segment.
By contrast, if you would like for your integrated value to reflect the data belonging to the entire analysis range, then clear this check box.
[ Graphic ]
4. Next to Maximum level of directory nesting in search, use the Up and Down arrow buttons to select the number of nested levels in which you would like Loudness Analyzer to search for log files.
[ Graphic ]
NOTES: |
• Selecting 3, for example, instructs Loudness Analyzer to search in the directory named in the path you will define later when you open a loudness log file and then within the next three nested levels down. |
• If you select 0, Loudness Analyzer only searches for log files within the immediate level of the directory named in the path. |
• The deeper you search into nested directories, the slower the search operation will be. |
5. Next to Loudness Range in Plot, do ONE of the following:
• Select a preset loudness range to be visible in your data plot (taking note of the range values).
[ Graphic ]
OR,
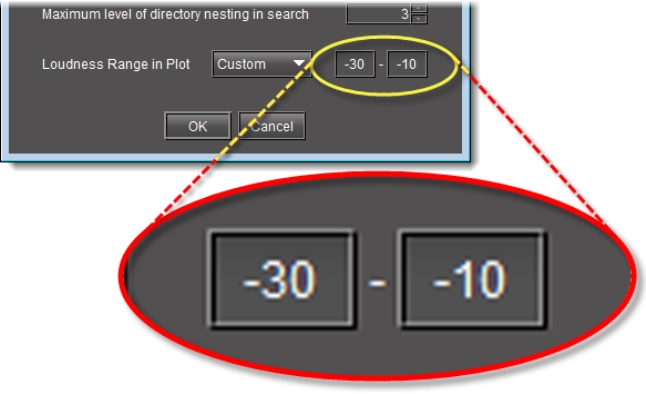
a) Select Custom.
[ Graphic ]
b) Manually enter a custom range.
[ Graphic ]
6. Click OK.