Example — Monitoring a Virtual Alarm
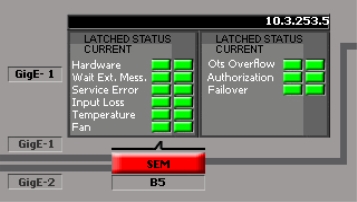
The following example shows how to investigate the error status of a virtual alarm. In this example, let’s consider a Web page set up to monitor a signal path that contains an SNMP device such as a Motorola SmartStream Encryptor/Modulator (SEM). The Web page might represent the SEM portion of the signal path as shown below.
The SEM is represented by a button that corresponds to a virtual alarm with several sub-alarms. Some of the sub-alarms are displayed in a panel on the Web page (Hardware, Temperature, Fan etc.). The panel shows the current and latched statuses of these sub-alarms, while the button shows the overall status of the SEM virtual alarm.
[ Graphic ]
The button is red, indicating a problem with the SEM. But the status panel is all green, indicating that the problem must come from another source. Here’s how to go about tracking the problem down:
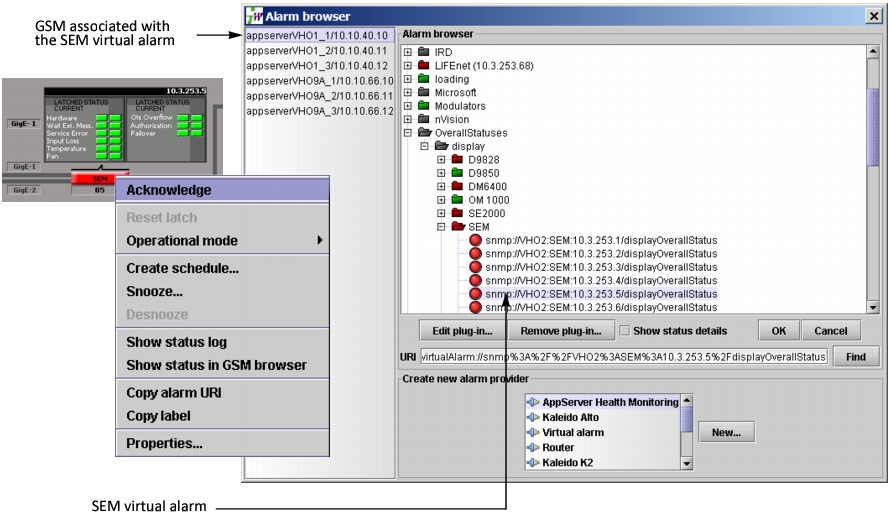
1. Right-click the SEM button, and then select Show status in GSM browser from the drop-down menu.
System Response: The GSM Alarm browser window appears, with the virtual alarm highlighted (the GSM running the SNMP plug-in instance for this particular SEM is also highlighted).
[ Graphic ]
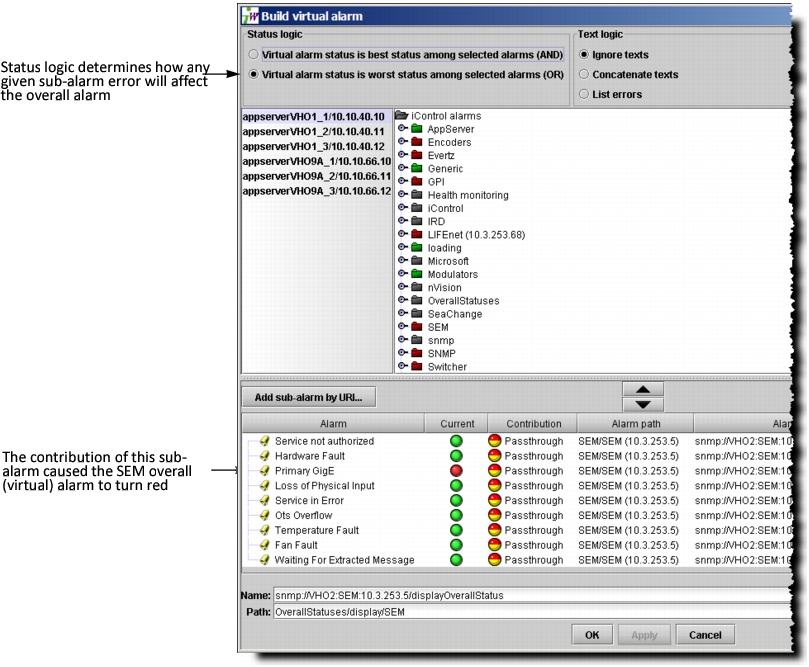
2. Click Edit plug-in.
System Response: The Build virtual alarm window appears, revealing the setup of the SEM virtual alarm, including a list of its sub-alarms. In this case, the Primary GigE sub-alarm is red—this is the likely source of the problem.
[ Graphic ]
3. So far, we have only been looking at the SEM’s overall alarm. At this point, it might be useful to look at the alarms for the device. The fastest way to do this is to return to the Web page and right-click any one of the SEM sub-alarms, and then select Show status in GSM browser from the drop-down menu.
System Response: The GSM Alarm browser window appears, with the sub-alarm highlighted inside the folder containing all of the SEM’s sub-alarms. Looking a little further down the list, we can se the Primary GigE sub-alarm is red.
[ Graphic ]
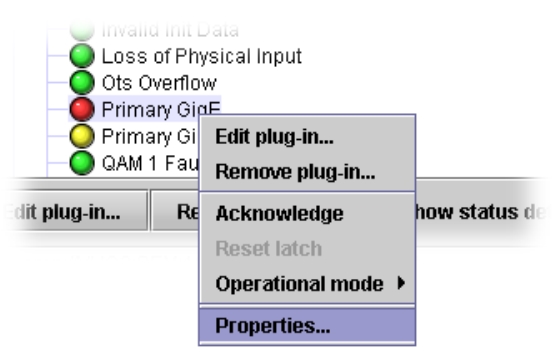
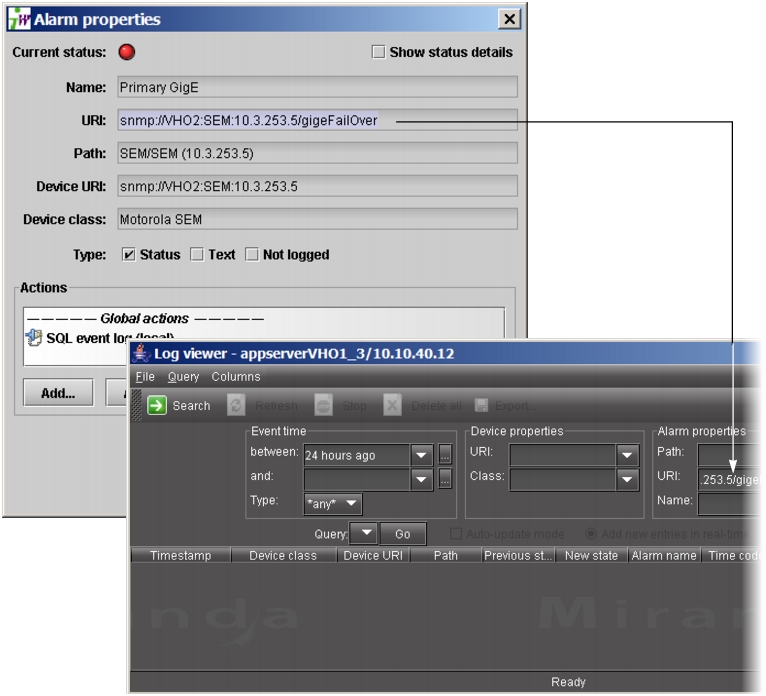
4. Right-click the Primary GigE sub-alarm and click Properties.
[ Graphic ]
System Response: The
Alarm properties window appears. You can copy the URI for this alarm and use it to search the Event and Incident Logs (
click HERE).
[ Graphic ]
5. Assuming you are able to resolve the problem, you would observe the following changes in iControl:
• The SEM alarm status on the Web page returns to normal (green).
• The Log Viewer displays a new entry reflecting the changed alarm status (returning from error to normal).
• In the GSM Alarm Browser, the status of the SEM overall alarm and of the Primary GigE sub-alarm return to normal (green).
• In iC Navigator, the status of the SEM overall alarm returns to normal (green).