Zooming into Loudness Analyzer’s Data Plot
After loading a loudness data file into Loudness Analyzer, the plot of the loudness data may not show, by default, the granularity of detail you might like to see at first. Additionally, the time period covered by the data may cover too large a time span.
You can effectively zoom into the data by specifying a subset time period within the initial graph, thereby increasing granularity and removing extraneous data.
NOTE: You may choose to either configure analysis parameters before you zoom or after you zoom with the same end-effect. You will lose analysis parameter data ONLY when you click Default Analysis. |
REQUIREMENT: |
Before beginning this procedure, make sure you have opened a loudness data file in Loudness Analyzer ( click HERE). |
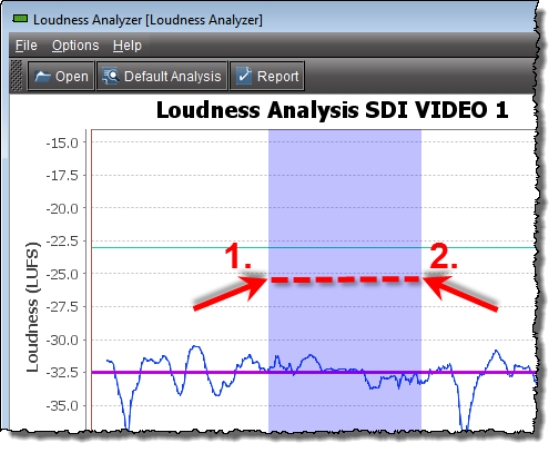
1. In Loudness Analyzer, do ONE of the following two sub-procedures:
a) On the data plot, use your mouse to click and hold on any point along the vertical line marking the desired beginning time of your zoom.
b) Drag the mouse to any point along the vertical line marking the desired end time of your zoom.
c) Release the mouse button.
[ Graphic ]
OR,
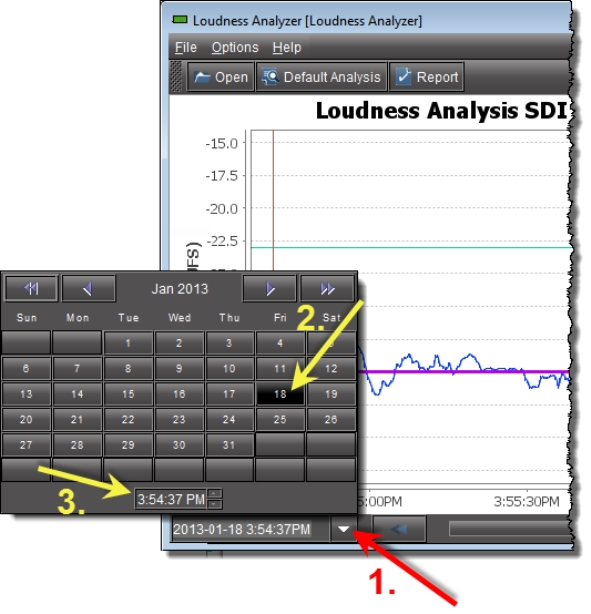
a) On the bottom-left side of Loudness Analyzer, use the Start-time calendar to indicate the exact beginning date and time of your zoom.
[ Graphic ]
b) On the bottom-right side of Loudness Analyzer, use the End-time calendar to indicate the exact end date and time of your zoom.
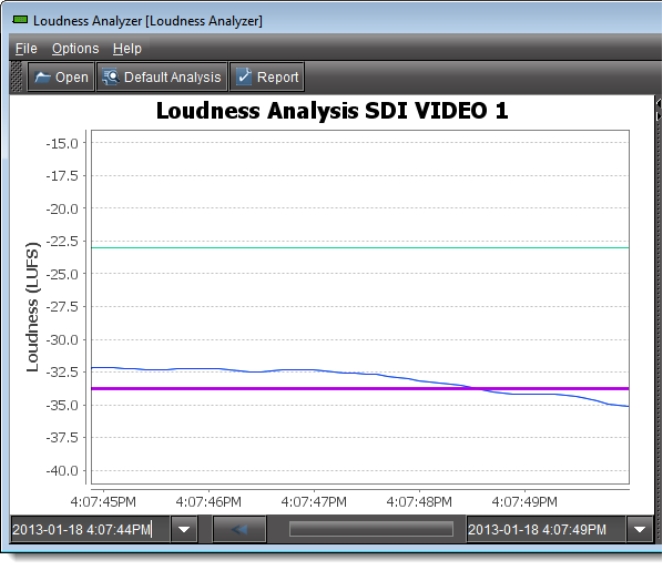
Loudness Analyzer reloads the data stream using the new time range demarked by the new start- and end-times.
[ Graphic ]
2. Repeat
step 1 if you must zoom into the data plot further.